









For VPs of preconstruction and senior preconstruction leaders at US general contractors who suspect coordination gaps are costing more than the RFI log shows.
Key Takeaway: Coordination failures rarely show up as one traceable mistake. They show up as a pattern, RFIs that shouldn’t exist, change orders that trace back to a missed alignment, rework absorbed quietly into the schedule, and industry research consistently puts the cumulative cost at roughly 5% of total project value. On a $40 million project, that’s on the order of $2 million, not from a single error, but from dozens of small ones that were never traced back to a cause.
What a VP of Preconstruction Actually Sees, and What Gets Missed
A VP of preconstruction at a mid-sized US general contractor has usually seen enough projects to know the difference between how a job is planned and how it actually plays out. The visible signals are familiar:
- Clashes that weren’t resolved in time, converted into field problems once trades are already mobilized.
- Change orders that look isolated but trace back to a missed coordination point nobody flagged at the time.
- RFIs that get raised because two disciplines’ documents were never fully reconciled.
- Closeout numbers that come in slightly off, without a single line item that explains why.
Individually, each of these looks manageable, the kind of thing that gets absorbed into “part of the job.” The problem is what happens in aggregate: the pattern repeats across projects, and the real cost of it rarely gets quantified into a single number a preconstruction leader can point to before the project closes.
There’s also a quieter category worth naming separately: problems sensed but rarely articulated. A phase that keeps generating RFIs for reasons nobody has fully diagnosed. Closeout numbers that land slightly off from the estimate, repeatedly, without a clean explanation.
A change that felt inevitable in the moment but, on reflection, probably wasn’t. These don’t get raised in a project review because there’s no data attached to them, just a pattern a VP has learned to recognize after enough projects.
Left unexamined long enough, that pattern starts raising a harder question: is this a team issue, a process issue, or simply the nature of the project type? Without the data to answer it, the question tends to get carried forward into the next project instead of resolved.
The Real Cost of Coordination Failures: What the Data Actually Shows
The instinct that coordination gaps are costing real money isn’t wrong. Multiple independent data sources converge on a consistent picture:
- The Construction Industry Institute’s research puts average direct rework costs at roughly 5% of total construction cost, a figure drawn from CII’s long-running rework research program, including its “Making Zero Rework a Reality” study and a related analysis of 359 projects in the CII database, and one of the most consistently cited benchmarks in the industry.
- A landmark 2013 Navigant Construction Forum study, analyzing 1,362 projects and over 1 million individual RFIs, found the average RFI costs $1,080 to process, with a median response time of 9.7 days, and 9.9 RFIs generated per $1 million of construction value, meaning a mid-sized project can easily generate hundreds of RFIs before it closes out.
- A 2026 peer-reviewed study published in the journal Buildings found that design coordination meetings alone run $8,000 to $23,000 per session in project team time, and that individual design errors caught late in the process can exceed $26,000 each, costs that accrue whether or not anyone ever traces them back to a specific coordination gap.
None of these figures describe one catastrophic failure. They describe the accumulated cost of a process where coordination gaps get discovered late, one RFI, one change order, one field adjustment at a time.
The exposure isn’t uniform across project types either. Projects with dense, competing systems, hospitals, laboratories, data centers, high-rise towers with tight mechanical floors, generate a disproportionate share of coordination-driven RFIs and change orders, simply because there are more places for architectural, structural, and MEP scope to collide in the same physical space.
A preconstruction team running a straightforward, low-complexity build and one running a fully-serviced healthcare facility should not expect the same coordination-cost exposure, even at similar total project value, and treating them the same in a budget or a risk assessment understates the real number on the more complex job.
See what this looks like on a real deliverable. Request a free sample coordination-focused BIM model from Excelize’s team, scoped to a project type similar to yours.
Get a Free Sample→What a $2M Exposure Looks Like on a $40M Project
Applying the CII’s roughly 5% rework benchmark to a representative project size makes the exposure concrete:
| Project Size | Estimated Coordination-Related Cost Exposure (at ~5%) |
|---|---|
| $10M | ~$500,000 |
| $40M | ~$2,000,000 |
| $100M | ~$5,000,000 |
This isn’t one mistake showing up as a $2 million invoice. It’s the cumulative total of RFIs at roughly $1,080 apiece, change orders traced back to missed alignments, and field adjustments that could have been resolved in the model instead of on site. The number is real; it’s just distributed across the project in a way that never gets summed up until the job is already closed.
Two things make this table a starting point rather than a precise forecast. First, the CII’s roughly 5% figure is an average direct rework cost across a wide range of project types, not a guarantee for any single job; the healthcare and data-center projects referenced above will typically run above that average, while a simple, repetitive building type may run below it.
Second, the figure captures direct rework cost, demolition, re-fabrication, and re-installation, without fully capturing the indirect cost of the schedule delay that usually accompanies it.
A crew standing idle while an RFI response is pending, at the roughly 9.7-day median from the Navigant study, carries its own labor and overhead cost on top of the rework itself. A preconstruction team building its own exposure estimate should treat the CII-based number as a floor, not a ceiling.
Why These Losses Stay Invisible Until Closeout
Every project generates the indicators, an RFI log, a change order register, a rework line item, but rarely gets them assembled into a single, forward-looking number:
- The costs are distributed, not concentrated. No single RFI or change order looks alarming on its own; the pattern only becomes visible in aggregate, usually after the project is already finished.
- The same phase keeps generating RFIs, and over time that gets normalized as “the nature of this project type” rather than investigated as a coordination gap with a traceable cause.
- There’s rarely data to confirm or rule out a cause. Is it the team, the process, or the project itself? Without a way to isolate the variable, the question stays open and gets carried into the next project instead of resolved.
- By the time the cost is visible, it’s already been absorbed into rework, change orders, and field fixes, past the point where a preconstruction decision could have prevented it.
The issue at that point isn’t team performance. It’s visibility into where the exposure sits while there’s still time to act on it.
Left unaddressed, this doesn’t announce itself as a crisis on any single project. It compounds quietly instead: margins come in a little lower than planned, the same coordination issue resurfaces on the next job, and the cost of fixing it gets absorbed into the work without ever being recognized as a distinct, addressable line item.
On one project, that’s a rounding error. Across a portfolio, over several years, it becomes a pattern that eventually raises questions about ownership and process, questions that are far harder to answer clearly after the fact than they would have been with visibility at the start.
Get visibility before your next project starts. Book a Discovery Session with Excelize’s team to walk through where coordination risk typically hides on projects like yours.
Book a Discovery Session→What Changes When Coordination Risk Becomes Visible Early
Preconstruction leaders who close this gap tend to rely on a specific set of practices, not a single tool:
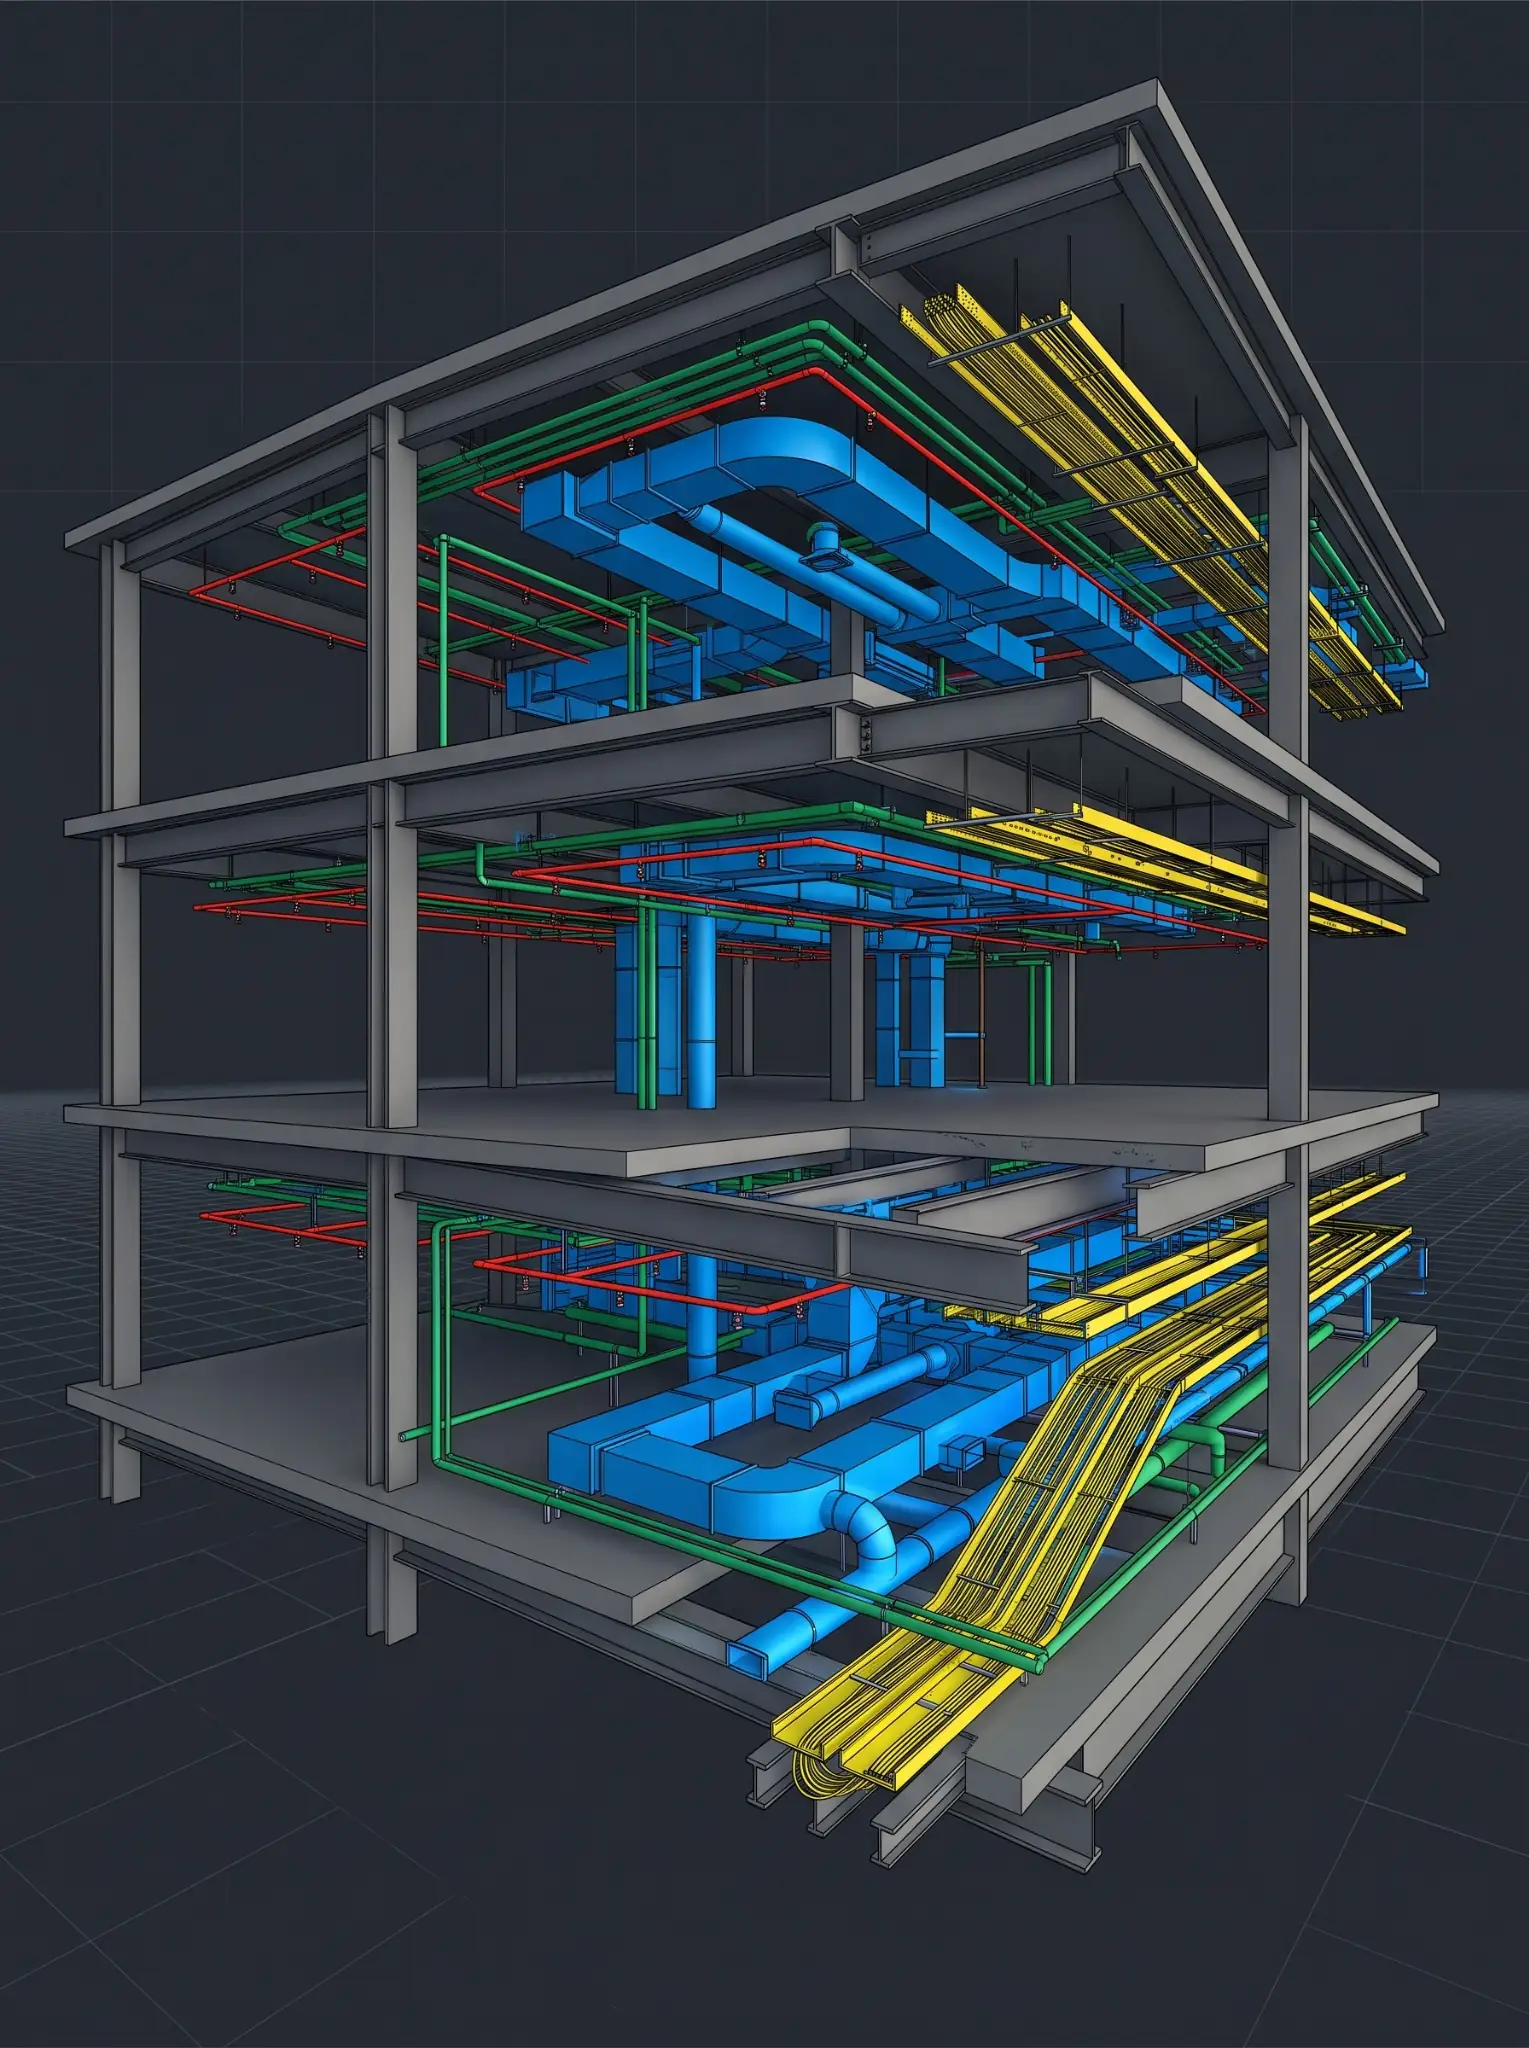
- Coordinated BIM modeling before design is finalized, so architectural, structural, and MEP conflicts surface in the model rather than in the field, where the CII’s rework figures and the Navigant RFI data both indicate the cost multiplies.
- Tracking RFI volume and cost by phase and discipline, not just logging them, so a repeating pattern gets flagged as a coordination gap rather than accepted as routine.
- Reviewing change orders for a traceable coordination cause, distinguishing genuine scope changes from change orders that are really unresolved coordination issues wearing a different label.
- Quantifying exposure before the project starts, using project size and historical rework rates to set an expected coordination-cost range, then tracking actual costs against that baseline as the job proceeds.
None of this eliminates coordination risk entirely, no project runs without some. What it does is convert a cost that’s currently invisible until closeout into one a preconstruction leader can see, quantify, and act on while it’s still controllable.
The sequencing matters as much as the practices themselves. Coordinated BIM modeling delivers most of its value when it happens before design is finalized and before subcontractors are mobilized, not as a documentation exercise run in parallel with construction. A clash caught in the model during design costs a modeling hour to resolve.
The same clash discovered by a crew standing in front of a duct that doesn’t fit costs the field delay, the re-fabrication, and, per the Navigant data, potentially another 9.7 days waiting on the RFI generated to resolve it.
The preconstruction teams that capture the most value from this shift are the ones that move coordination earlier in the schedule, not the ones that simply add a coordination step without changing when it happens.
Conclusion
What often gets accepted as an unavoidable part of the job, RFIs that shouldn’t exist, change orders with no clear cause, rework absorbed quietly into the schedule, is measurable, and the data behind it is consistent across independent sources: CII’s rework research, the Navigant RFI benchmark, and recent peer-reviewed coordination studies all point in the same direction. When that exposure becomes visible early, in preconstruction, decisions improve and margins stabilize before the money is already spent.
A VP who can point to a specific, sourced exposure range before a project breaks ground is operating with a different kind of authority than one relying on instinct alone, both internally, when defending a preconstruction budget, and with an owner who wants to understand where contingency is actually going.
Excelize has supported US general contractors with coordinated BIM modeling and clash detection since 2004, across more than 2,500 projects for over 300 clients.
Quantify your exposure. Send your project size and current coordination process to Excelize’s team for a quote on coordinated BIM modeling and clash detection.
Request a Quote→FAQ
What are coordination failures in construction?
Coordination failures occur when design, planning, and execution teams aren’t fully aligned, surfacing as RFIs that shouldn’t have been necessary, change orders traced back to a missed alignment, and rework discovered in the field rather than caught in the model.
How much do coordination failures actually cost a project?
Industry research consistently points to roughly 5% of total project cost, per the Construction Industry Institute’s rework research, though the exposure is distributed across RFIs, change orders, and field fixes rather than showing up as one line item. A 2013 Navigant Construction Forum study separately found the average RFI costs about $1,080 to process.
Why are coordination costs so hard to see before a project closes out?
Because the cost is spread across many small events, individual RFIs, isolated change orders, minor field adjustments, rather than concentrated in one traceable failure. Without a system for tracking these against a baseline, the pattern only becomes visible in hindsight, after the money has already been spent.
How can a preconstruction team reduce coordination risk?
By coordinating BIM models across disciplines before design is finalized, tracking RFI volume and cost by phase rather than just logging them, auditing change orders for a traceable coordination cause, and quantifying expected coordination-cost exposure before the project starts rather than discovering it at closeout.
What’s the connection between RFIs and overall project cost?
RFIs drive both direct costs (the roughly $1,080 average processing cost per the Navigant study) and indirect costs through schedule delays, since the median RFI response time is close to 10 days. High RFI volume on a specific phase or discipline is often a signal of an underlying coordination gap rather than a series of unrelated questions.
Excelize is a BIM services partner supporting US general contractors with coordinated BIM modeling, clash detection, and preconstruction risk assessment delivered by an extended BIM team.